 |
| Pan-STARRS public |
| Pan-STARRS project |
| Pan-STARRS IPP Wiki |
| PS1SC Wiki |
| PS1SC Access |
| PS1SC PSPS |
| PS1 Public Data |
| Documentation |
| Help |
Release Notes on PS1 Photometric Reference Ladder, Release 12.01
(up to PS1 Data Release)
(up to Documentation)
Photometric Reference Ladder, Release 12.01 Paper (pdf)
Partial Release Notes : Please see also the paper (above)
Comparison with 2MASS
The plots below compare the PS1 grizy photometry with 2MASS photometry by examining the location of the color-color locus for early (< K0) main sequence stars.
For each pixel (0.5 degree on a side), I select all objects with PS1 r
< 20 and detected JHK magnitudes, keeping only those with S/N in
the mean > 50 and standard deviations less than 0.05 magnitudes. I
then fit the stellar locus in g-r,r-i for the g-r range 0.2 to 1.0,
and keep only objects that fall within 0.05 of that (linear) stellar
locus fit.
I then fit the stellar locus with a line in each of the color-color diagrams
g-i,i-J; g-i,i-H; g-i,i-K. I measure the mean i-J color expected from
the fit for stars with g-i = 0.5. The figures below show the maps of
the i-J, i-H, and i-K offsets as well as the J-H and H-K offsets at
g-i = 0.5. The center of these maps is RA,DEC = 0,0, (east is left,
north is up). The pixels are 0.5 degrees on a side.
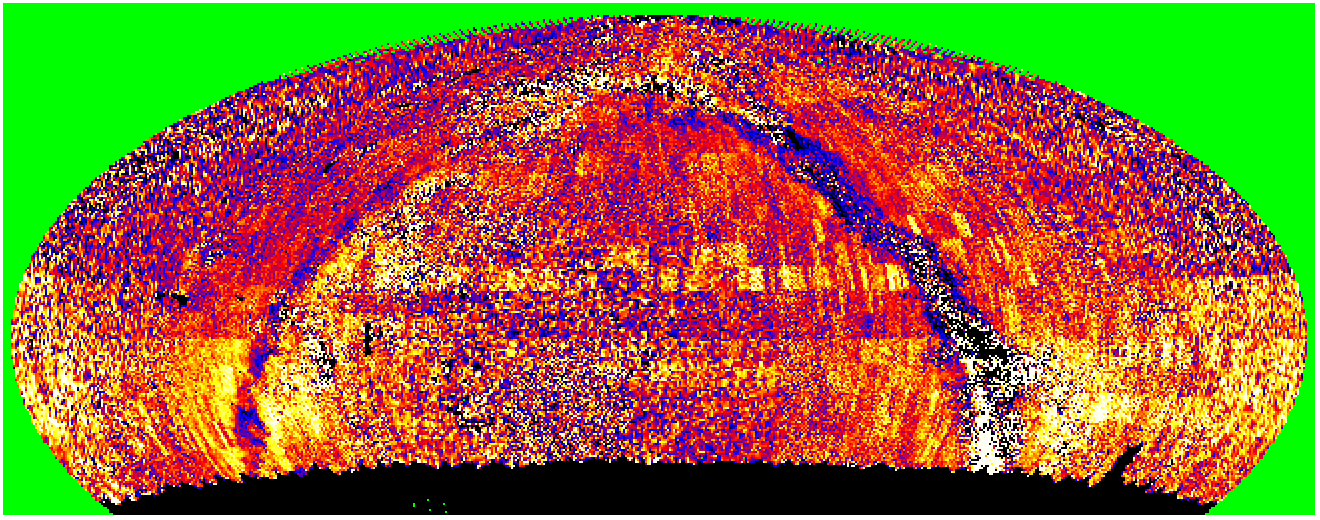
These maps show three main features. The Galactic Plane is quite
clear, and not surprising: this test is particularly sensitive to
reddening.
Several large scale patches are also visible (eg, the black patch near
RA ~ 150 deg). Disappointingly, these correspond to areas without
good ubercal ties -- in other words, these are regions in which the
data were obtained in non-photometric conditions. This shows the
limitation of using relative photometry to tie across individual
exposures. If the exposures have an extinction gradient, the
correction far from the photometrically tied region can drift from the
correct value. The largest region at RA ~ 150 matches a section with
poor i-band photometry and has a depth of roughly 0.1 magnitudes in
i-J. Assuming this is completely due to i-band errors, this
corresponds to about 0.06 magnitudes of drift to the center of this
region.
The third pattern is at a lower level of intensity: N-S strips with
roughly E-W bands. They are most noticable in K and H-K. These
appear to correspond well to the 2MASS scanning pattern, and have an
amplitude corresponding to about 0.02 - 0.04 magnitudes of offset in
K.
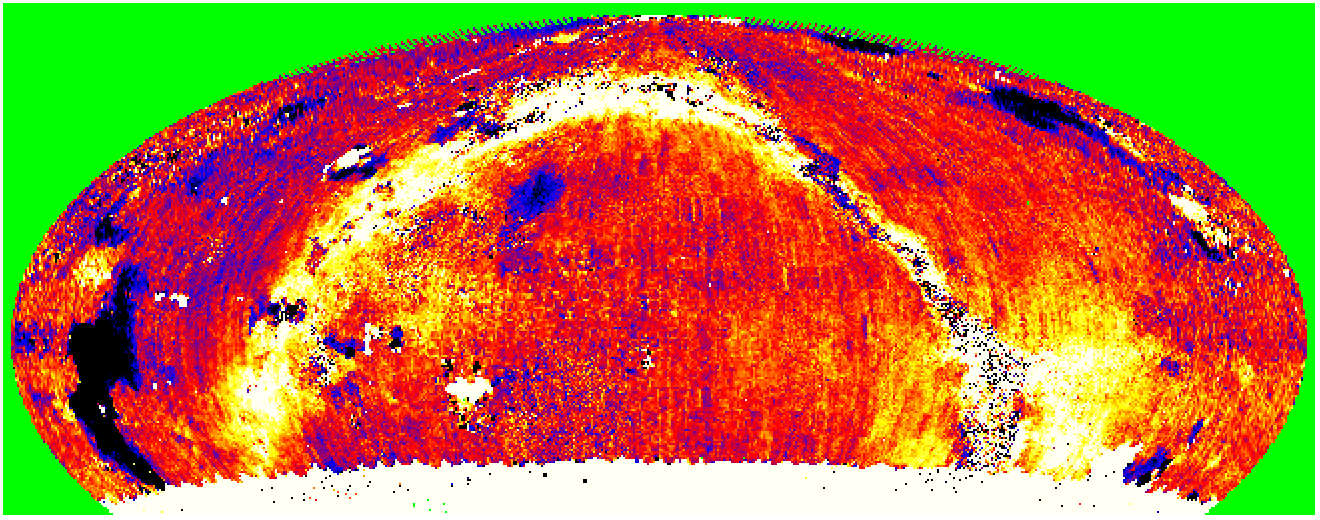
Map of the i-J color at g-i = 0.5.
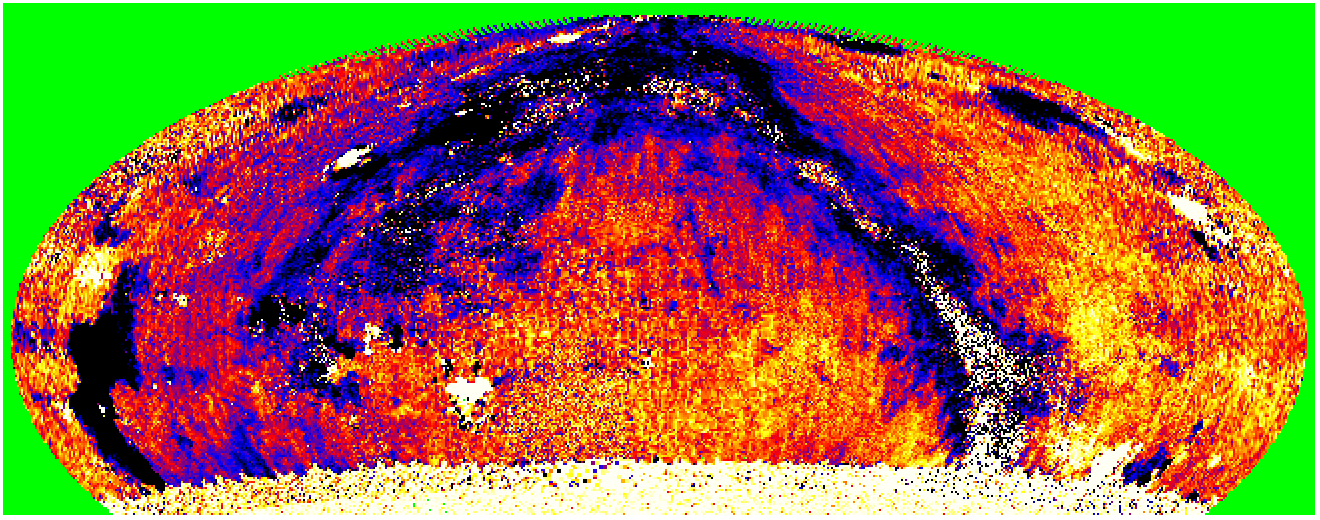
Map of the i-H color at g-i = 0.5.
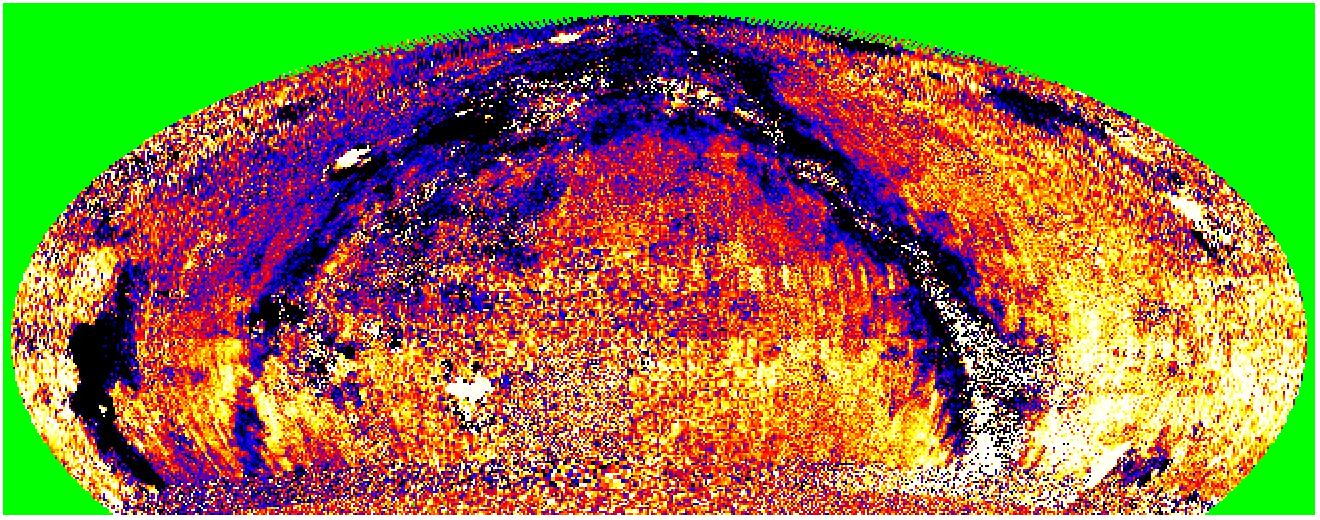
Map of the i-K color at g-i = 0.5.
Combinations of the above maps can highlight any problems in 2MASS which are driven by the color rather than the mean magnitudes.
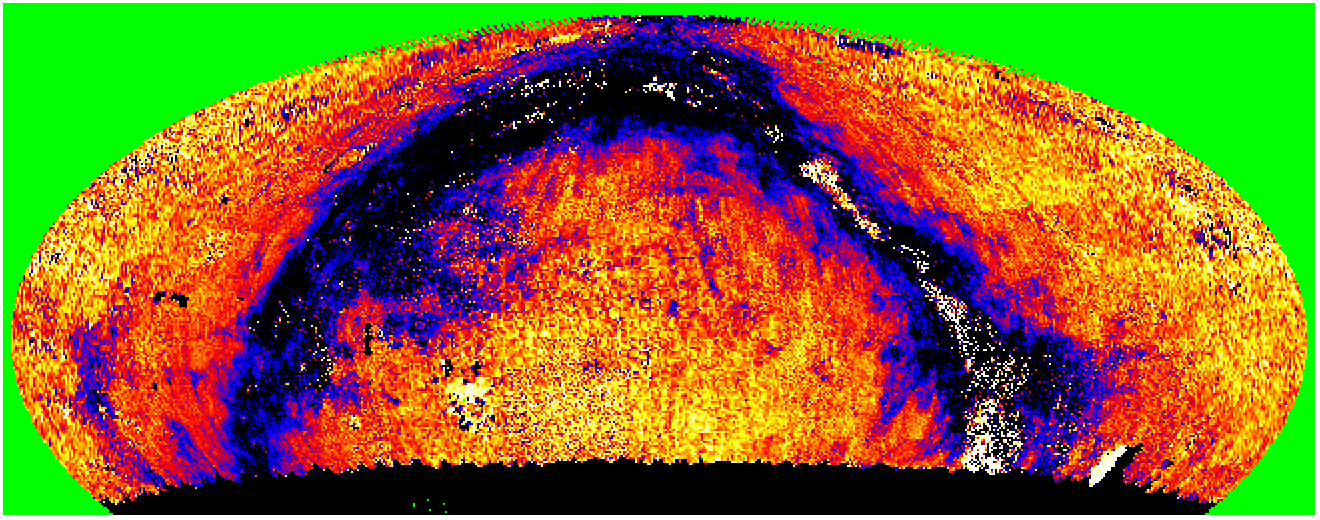
Map of the J-H color at g-i = 0.5.
Map of the H-K color at g-i = 0.5.